
Beyond Competitive Benchmarking: A Systematic Approach to Cost Reduction in Robotics Manufacturing
How cross-industry technology transfer achieves 25-40% cost reductions where traditional benchmarking plateaus at 5-10%. A technical framework for robotics manufacturers.

The Global Context: Supply Chain Diversification
The robotics industry is experiencing a fundamental restructuring of its supply chain. Historically concentrated in Japan, Germany, and the United States, component manufacturing has globalized significantly over the past decade.
Key Drivers:
Patent cliff effects: Critical patents from the 1990s-2000s entering public domain
Technology maturation: Manufacturing processes becoming standardized
Market demand: Humanoid robotics creating massive scale requirements
Geopolitical factors: Supply chain resilience prioritization
This article examines cost reduction strategies applicable globally, with case studies drawn from manufacturers across multiple regions. The principles of cross-industry technology transfer apply regardless of a company’s location or supply chain structure.
Introduction: The Cost Reduction Paradox
In the global robotics industry, “competitive benchmarking” has become the default playbook for cost reduction. Engineering teams worldwide follow a familiar ritual: disassemble competitors’ products, analyze their components, reverse-engineer their solutions, and attempt to replicate their cost structures.
Yet this widespread practice has led to an unexpected outcome: the more companies benchmark their competitors, the harder it becomes to achieve breakthrough cost reductions.
This article explores why competitive benchmarking alone is insufficient and presents a systematic framework for cost optimization through cross-industry technology transfer—a methodology that has helped manufacturers achieve 25-40% cost reductions where traditional approaches plateau at 5-10%.
Part I: Understanding the Cost Landscape Across Robot Types
The robotics industry encompasses diverse product categories, each with distinct cost structures requiring tailored optimization strategies.
1.1 Industrial Robots: The Global Component Market Evolution
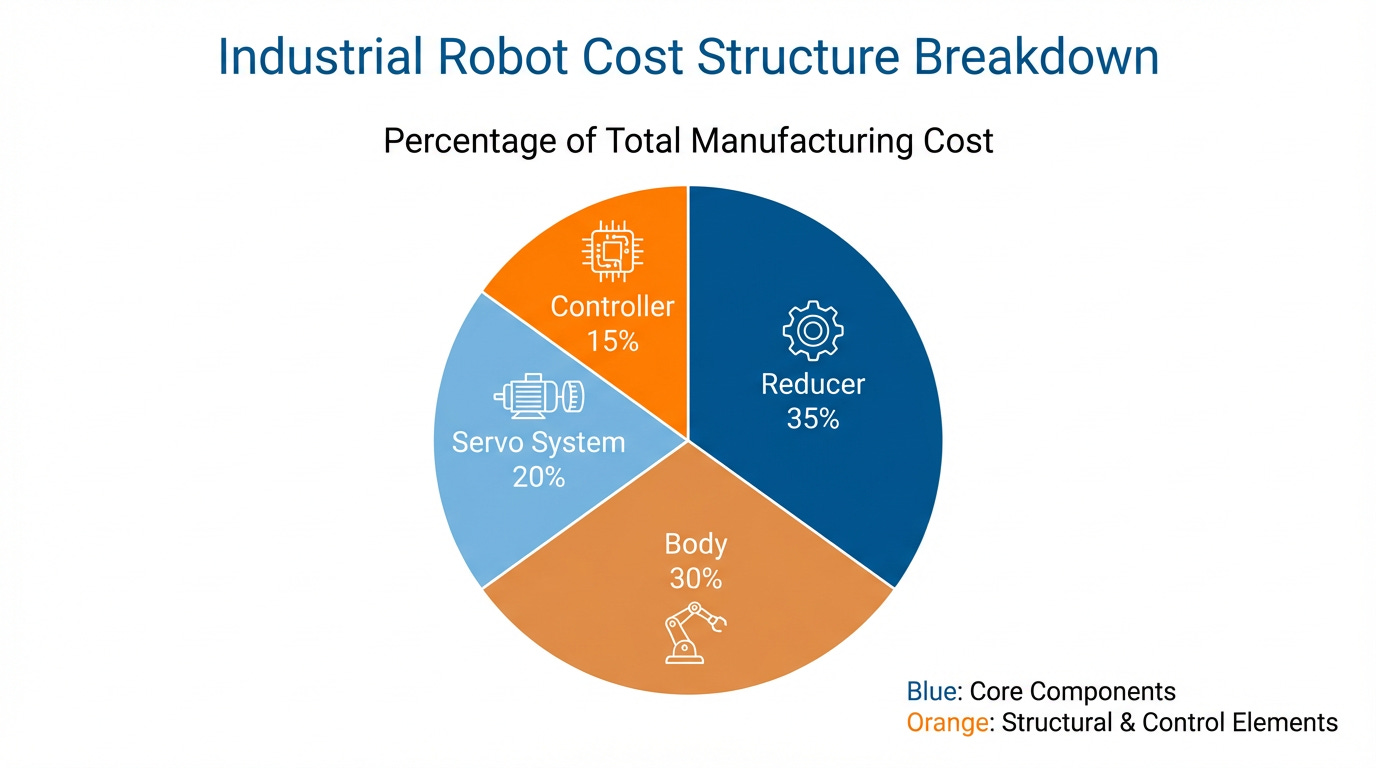
Figure 1: Cost breakdown of industrial robots showing the concentration of value in core components
Cost Structure:
Reducers: 35% (Harmonic drives: $3,000-$8,000 per unit)
Servo Systems: 20%
Controllers: 15%
Body & Assembly: 30%
Core components account for over 70% of total manufacturing costs. This concentration makes component-level innovation critical for any manufacturer, regardless of location.
Case Study: Precision Reducer Market Transformation
The precision reducer market illustrates how technology maturation drives global cost reduction:
Historical Market Structure (pre-2018):
Dominated by Japanese manufacturers (75%+ global market share)
High barriers to entry (precision manufacturing, IP protection)
Limited price competition
Average cost: $8,000-$12,000 per unit
Current Market Dynamics (2025):
Multiple qualified suppliers across regions
Performance parity achieved by new entrants
Competitive pricing pressure
Average cost: $3,000-$6,000 per unit
Technical Achievements by New Entrants:
Precision lifespan: 200 million cycles (exceeding established standards)
Size reduction: 40% volume decrease
Manufacturing scalability: Annual production capacity >1 million units
Global supply chain integration: Supporting major OEMs worldwide including Tesla, ABB, and FANUC
Impact on Robotics Manufacturers:
This supply chain diversification benefits the entire industry:
✓ Reduced component costs
✓ Improved supplier negotiating position
✓ Faster innovation cycles
✓ Supply chain resilience
✓ Geographic optionality
Key Insight: Technology democratization, not geography, drives cost reduction. Manufacturers in North America, Europe, and Asia all benefit from competitive supplier ecosystems.
Body Structure Innovation: Global Best Practices
Multiple manufacturers worldwide have demonstrated lightweighting potential through advanced manufacturing techniques:
Example: Modern Manufacturing Approaches
Full cast-aluminum construction
30% weight reduction vs. welded alternatives
Integrated component routing
Enhanced structural rigidity
Technology Sources:
Automotive die-casting (Tesla, Toyota, BMW)
Aerospace composite structures (Boeing, Airbus)
Consumer electronics unibody design (Apple, Samsung)
Implementation Results:
Material cost reduction: 15-20%
Assembly time savings: 40%
Quality consistency improvement: 35%
Reduced tooling complexity
These techniques are geography-agnostic and transferable across regions, with successful implementations documented in North American, European, and Asian manufacturing facilities.
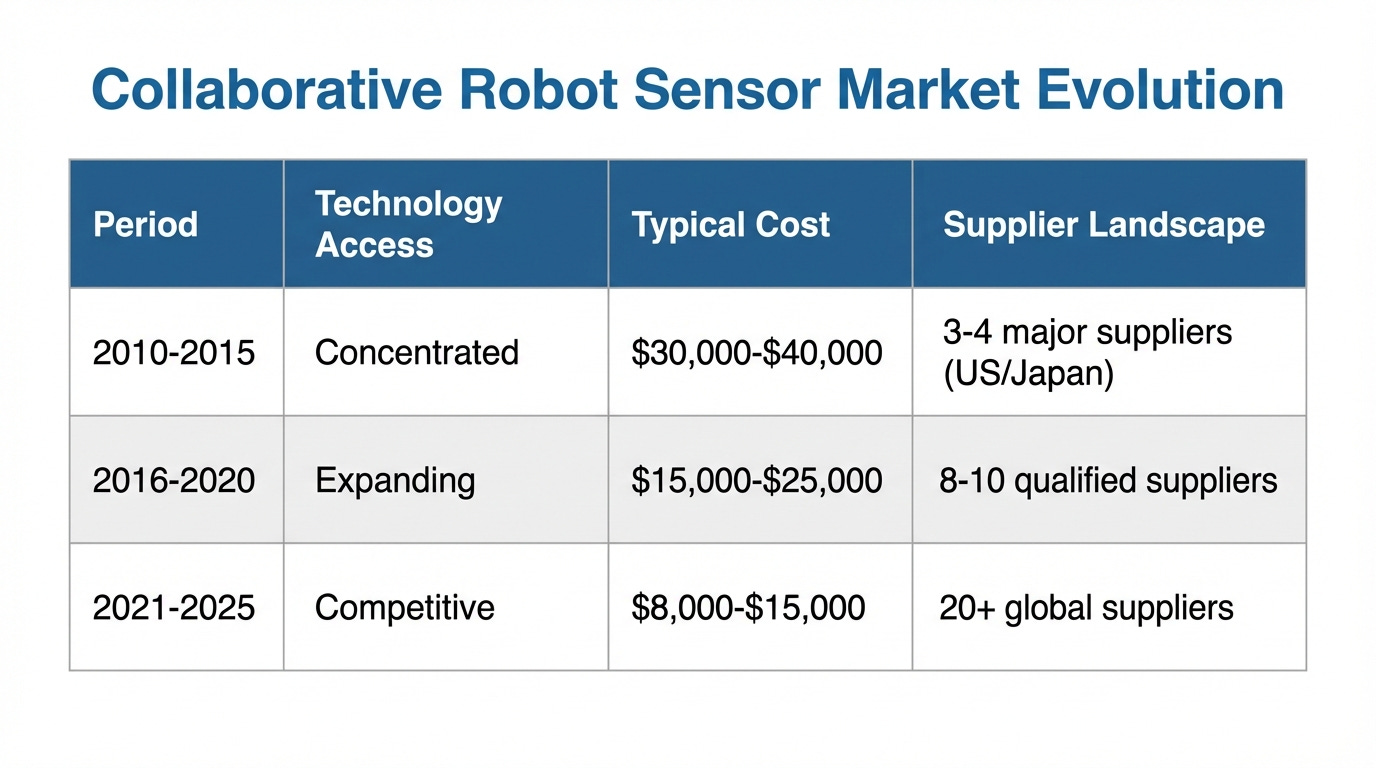
1.2 Collaborative Robots: Global Sensor Market Maturation
Collaborative robots (cobots) face unique cost pressures from safety requirements, but the component landscape has evolved dramatically.
The Safety Sensor Economics:
Force/torque sensing represents a significant cost driver in collaborative robotics. The market has evolved from a concentrated oligopoly to a competitive global ecosystem.
Market Evolution Timeline:
Drivers of Cost Reduction:
Technology maturation: Manufacturing processes standardized
Patent expirations: Core IP entering public domain
Volume production: Humanoid robotics driving scale
Regional production: Manufacturing closer to end markets
Alternative technologies: Current-based sensing reducing sensor dependency
Geographic Distribution of Qualified Suppliers (2025):
North America: 6 suppliers
Europe: 5 suppliers
Asia: 12 suppliers
Other regions: 2 suppliers
Architectural Options for Cost Optimization:
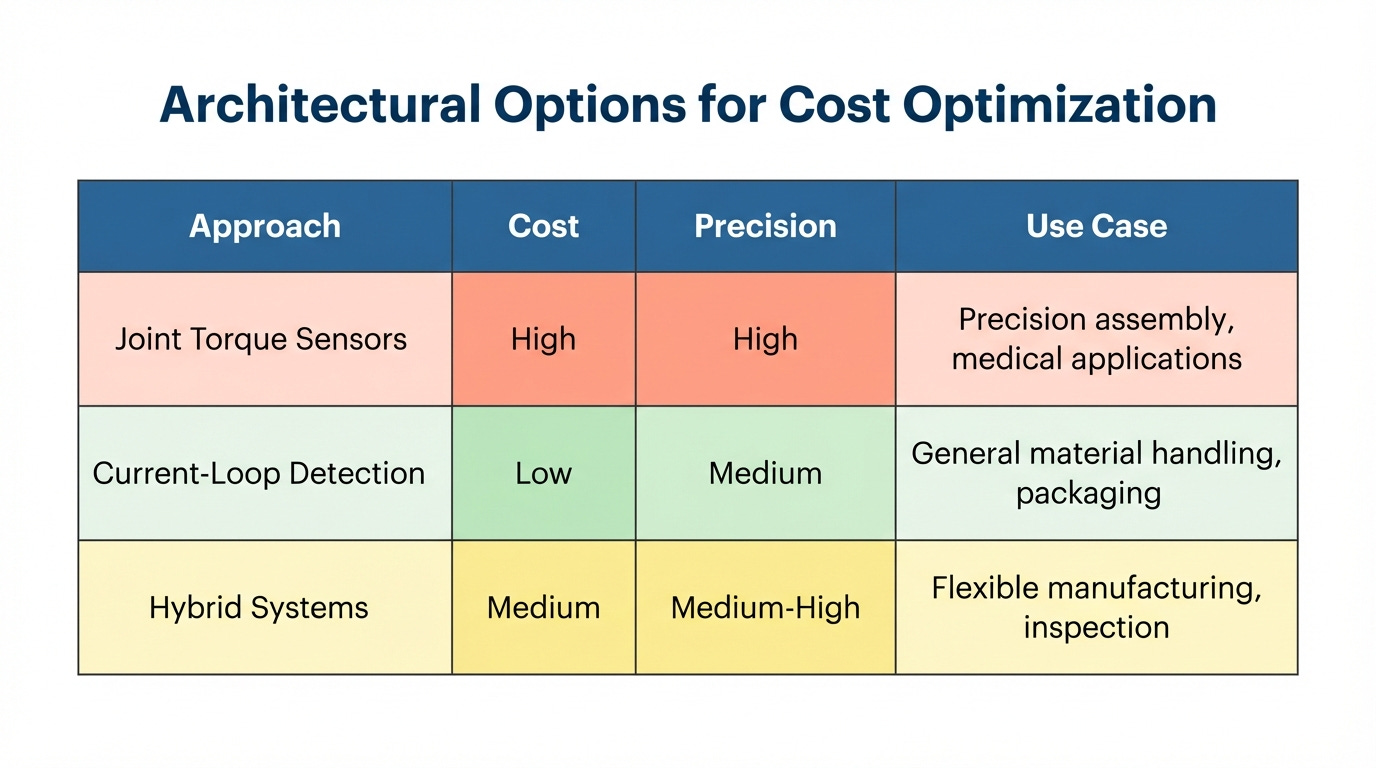
Strategic Implications:
Modern cobot manufacturers can:
Source from multiple qualified suppliers globally
Negotiate competitive pricing
Maintain supply chain resilience
Choose optimal cost-performance balance
This represents industry maturation, not regional dominance—quality sensors are available worldwide at dramatically reduced costs compared to a decade ago.
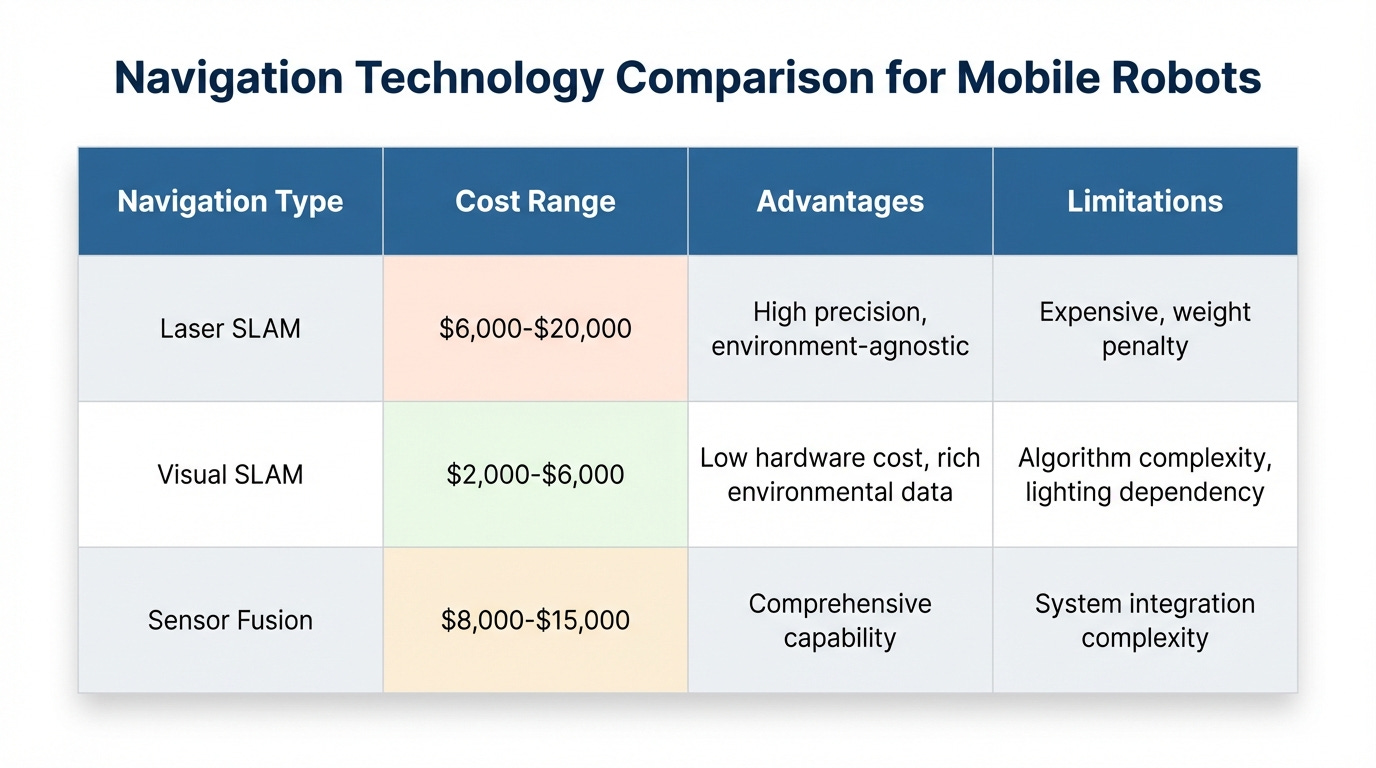
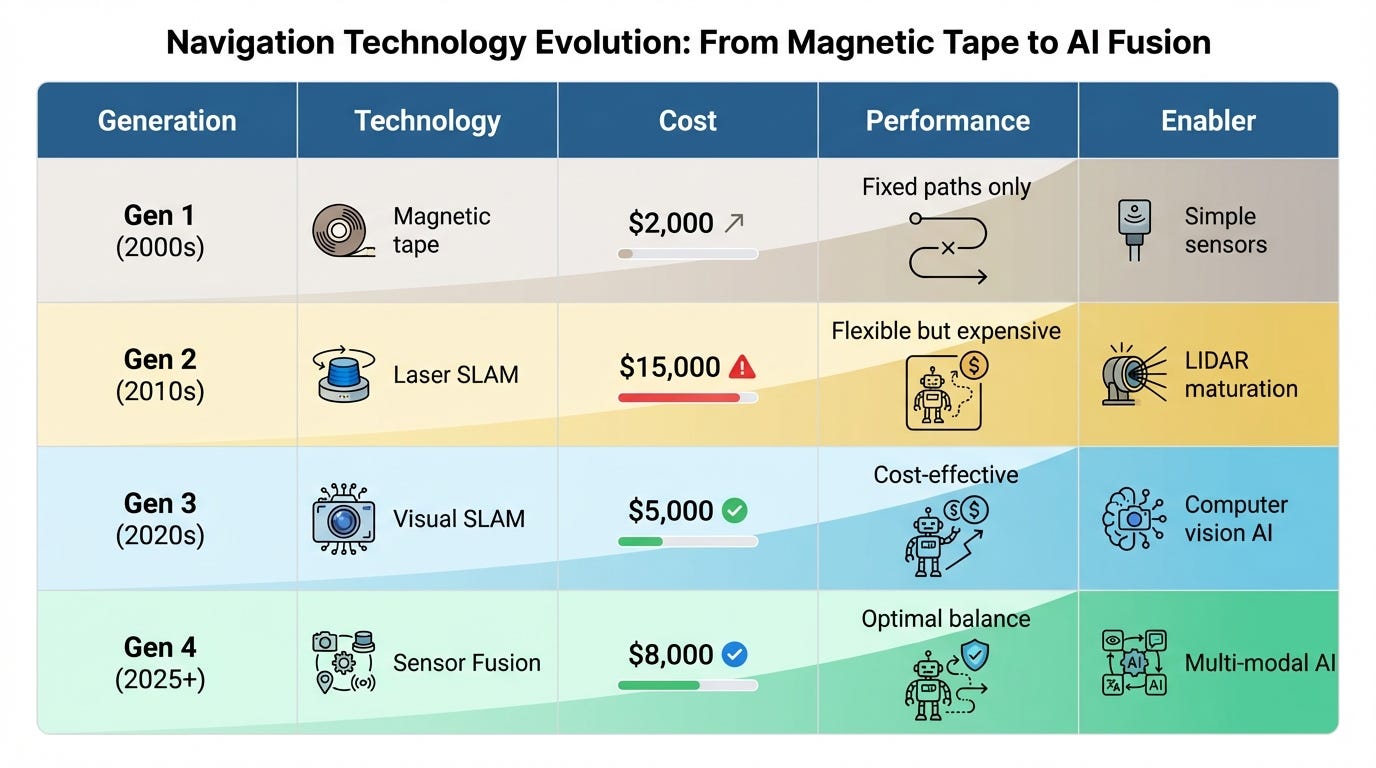
1.3 Mobile Robots (AMR/AGV): The Navigation Economics
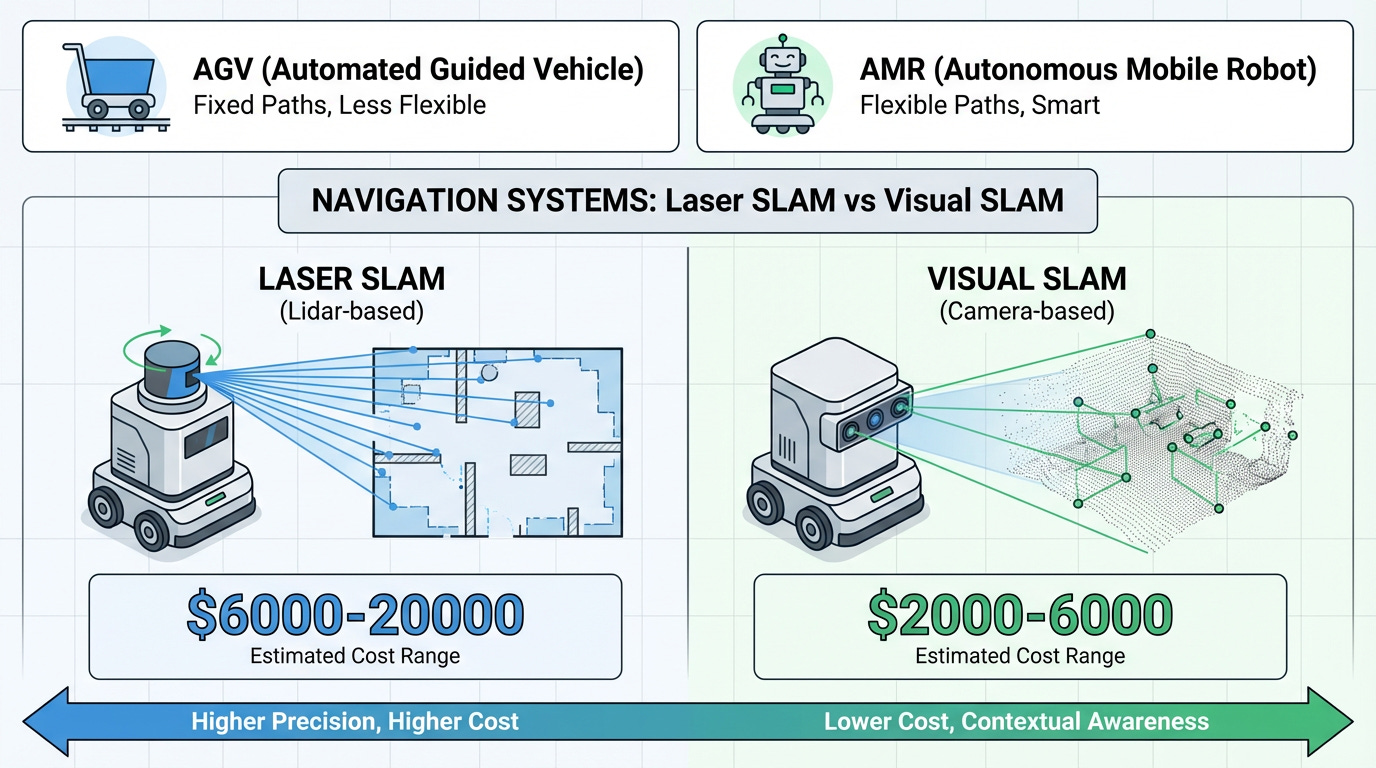
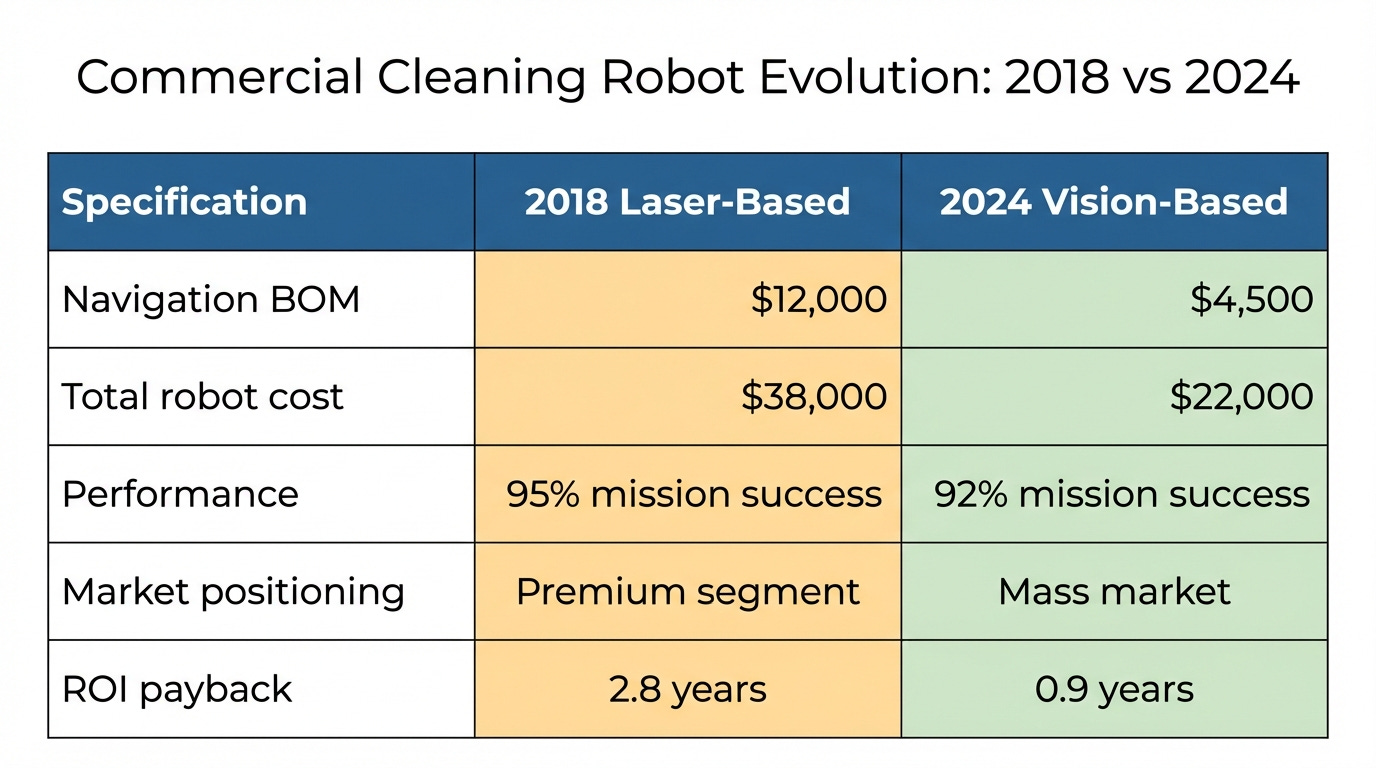
Figure 2: Comparative analysis of laser SLAM vs visual SLAM navigation systems showing the dramatic cost differential
Navigation systems represent 40% of mobile robot costs, creating a critical optimization opportunity.
Technology Comparison:
Technology Evolution Drivers:
The dramatic cost reduction in visual navigation stems from:
Autonomous vehicle R&D spillover: Billions invested in computer vision
Embedded computing advances: High-performance SoCs at consumer price points
Algorithm maturation: Open-source SLAM frameworks (ORB-SLAM, RTAB-Map)
Component commoditization: Industrial-grade cameras <$200
Market Impact Analysis:
Commercial cleaning robots exemplify the economics:
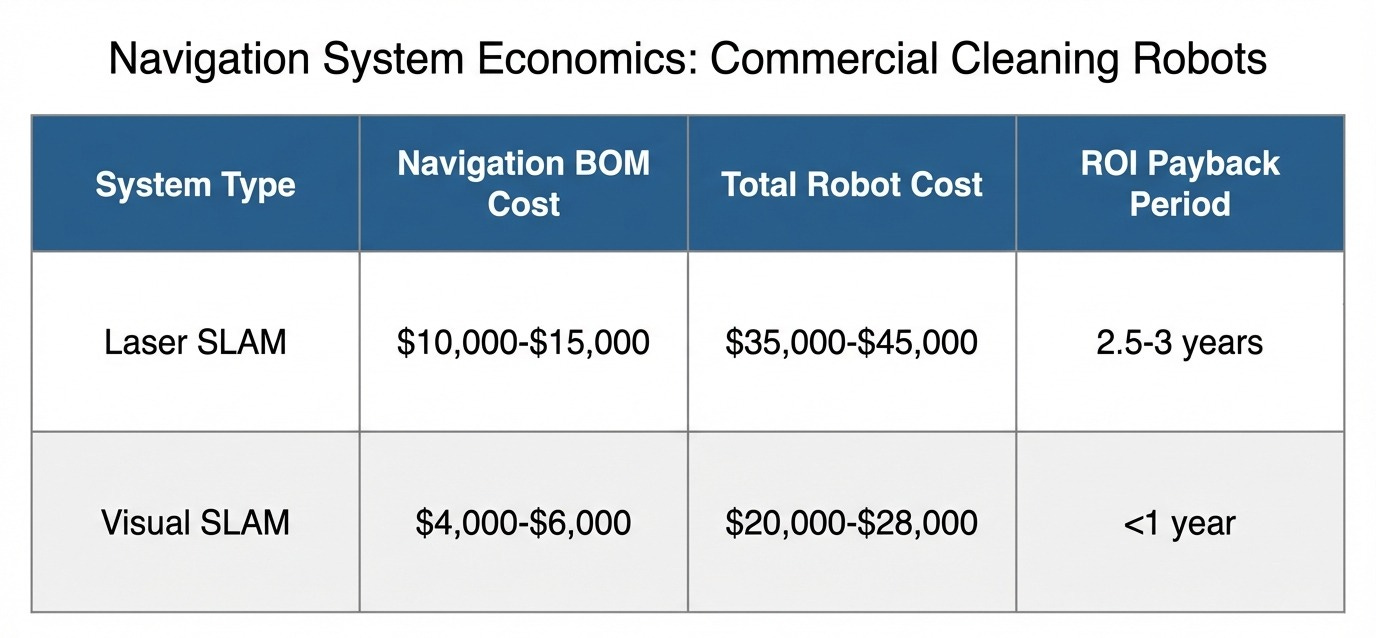
This cost structure transformation has:
Unlocked mass market adoption in hospitality and retail
Enabled ROI-positive deployments in mid-size facilities
Accelerated market penetration in price-sensitive segments
Regional Deployment Patterns:
Interestingly, technology choice varies by market maturity:
Mature markets (US, EU, Japan): Hybrid systems gaining share
Emerging markets (Southeast Asia, Latin America): Visual SLAM dominance
Industrial environments globally: Laser SLAM remains standard for mission-critical applications
1.4 Humanoid & Quadruped Robots: The Scaling Challenge
Humanoid robots represent the frontier of cost reduction innovation, with dramatic price compression over the past 24 months.
Cost Structure:
Joint modules: ~30%
Perception systems: 15-20%
Computing platforms: 10-15%
Body structure: 20-25%
Integration & assembly: 10-15%
Market Price Evolution:
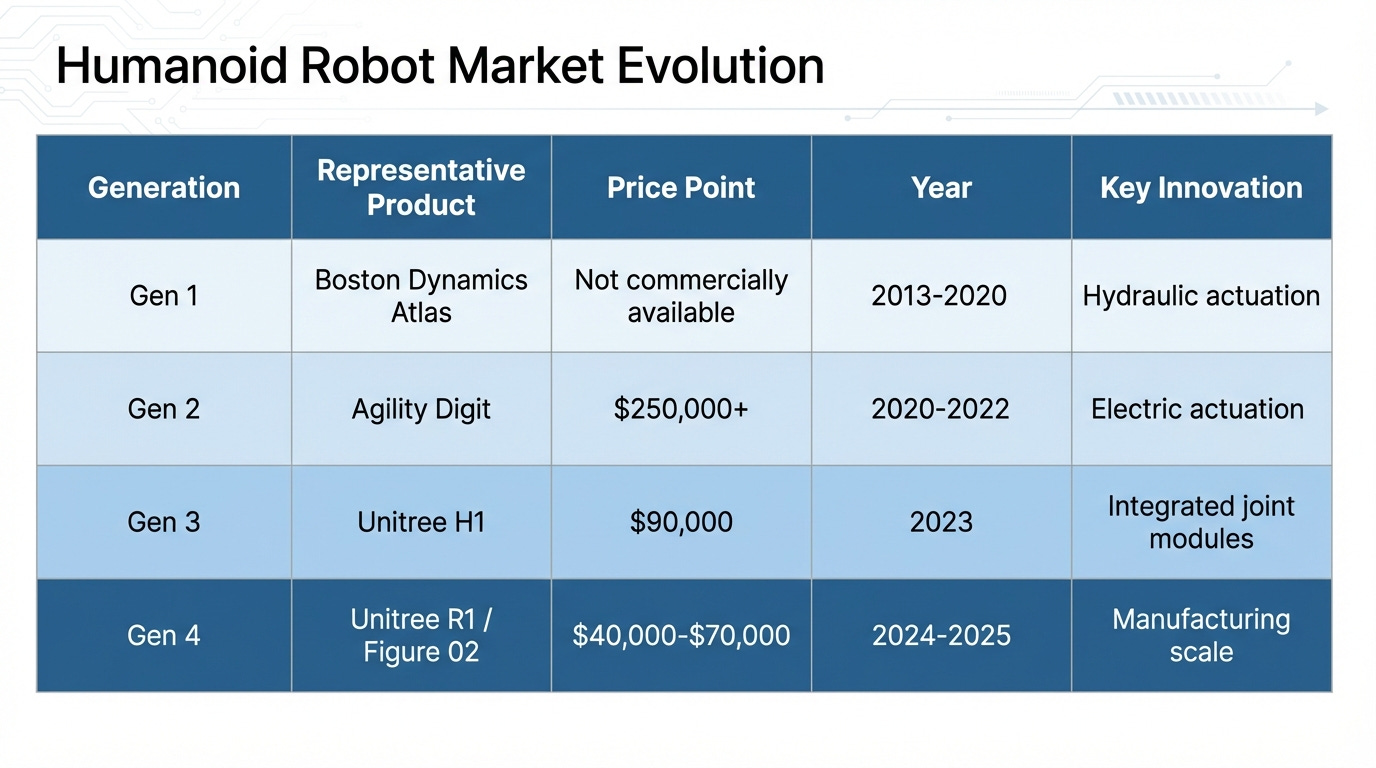
Breakthrough Pricing: Sub-$50K Humanoids
Recent announcements demonstrate rapid cost reduction:
Unitree R1: $39,900 (consumer-grade specifications)
Figure 02: $60,000-$70,000 (industrial-grade, BMW deployment)
Tesla Optimus: Projected $20,000-$30,000 at scale (2026+ estimate)
Key Success Factors Enabling Cost Reduction:
Technology Reuse from Quadruped Platforms
Proven joint designs
Validated control algorithms
Mature supply chains
Reduced R&D amortization
Manufacturing Scale Economics
Volume commitments enabling supplier investment
Automated assembly lines
Standardized testing protocols
Shared tooling across product families
Design-for-Manufacturing Principles
Part count reduction: 40% fewer components vs. Gen 2
Assembly time optimization: <2 hours total assembly
Standard fasteners and connectors throughout
Modular serviceability
Vertical Integration of Critical Components
In-house joint module production
Custom ASIC development for control
Proprietary battery systems
Integrated manufacturing eliminates supplier margins
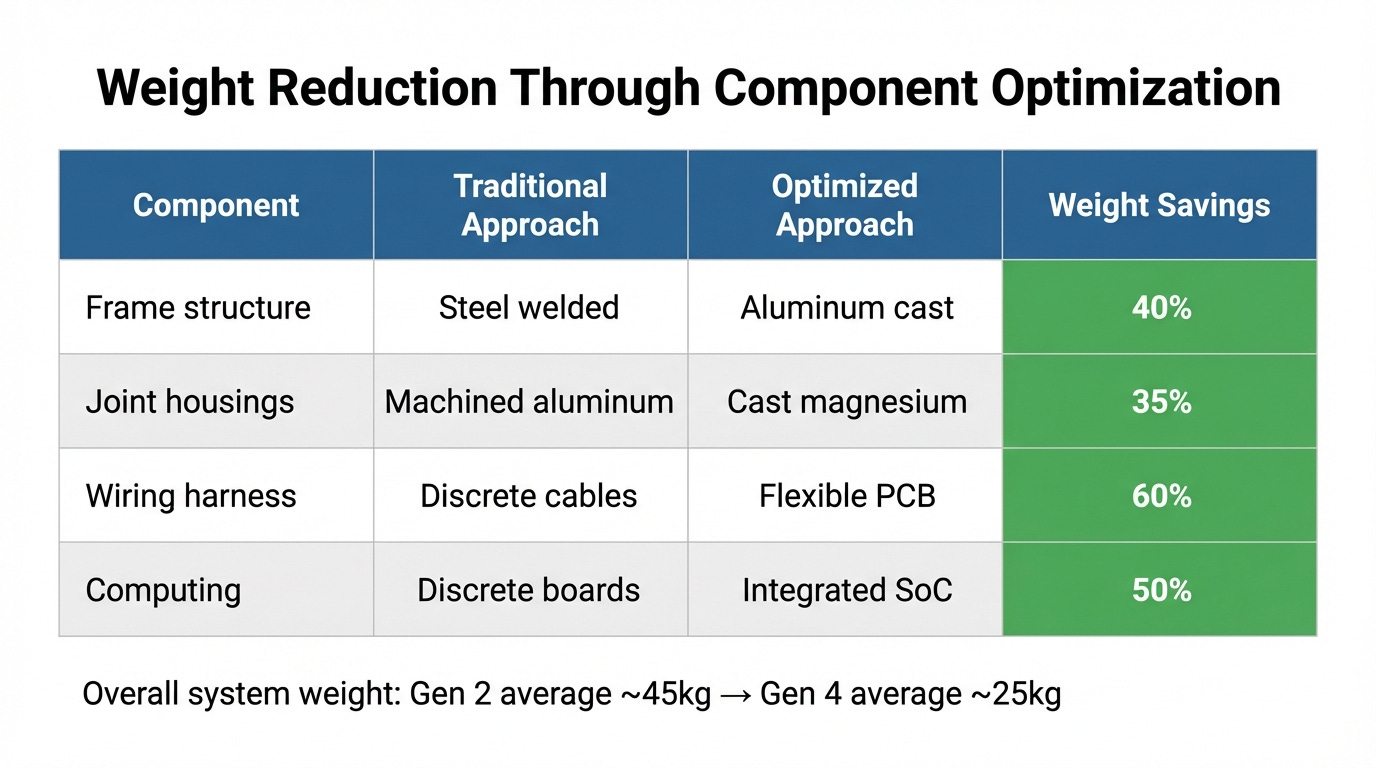
Weight Reduction Achievements:
Manufacturing Maturity Indicators:
The humanoid sector is transitioning from R&D to manufacturing:
Production volumes: Single units → Hundreds per month
Supply chain: Custom one-offs → Standard catalog parts
Quality systems: Lab validation → ISO 9001/IATF 16949
Service infrastructure: Factory-only → Distributed service centers
Part II: The Structural Limitations of Competitive Benchmarking
2.1 The Follower’s Dilemma
Competitive benchmarking suffers from an inherent asymmetry: you see your competitor’s solution, but not their problem-solving process.
When you reverse-engineer a competitor’s product, you observe:
✓ Component selection
✓ Assembly methods
✓ Material choices
✓ Final specifications
But you don’t see:
✗ Failed prototypes and design iterations
✗ Constraint trade-offs during development
✗ Patent landscapes navigated
✗ Supplier capability limitations encountered
✗ Cost-benefit analyses that drove decisions
This information asymmetry ensures you remain perpetually one step behind.
Real-World Example:
A North American robotics manufacturer spent 14 months reverse-engineering a competitor’s innovative gripper mechanism, successfully replicating its functionality. However:
Development cost: $480,000
Performance: 92% of original (subtle material science differences)
Market entry: 18 months after competitor
Patent issues: Required $120,000 redesign to avoid infringement
Outcome: Total investment of $600,000 to achieve parity with 18-month lag—resources that could have funded original innovation.
2.2 The Patent Maze
Mature products are protected by extensive IP portfolios. Attempting to replicate designs leads to complex navigation challenges.
Patent Avoidance Costs:
Increased redesign complexity
Performance compromises to avoid infringement
Extended development timelines
Higher engineering resource consumption
Legal consultation expenses
Case Study: Precision Bearing System
A European manufacturer attempted to replicate a patented crossed-roller bearing arrangement used in competitive robotic joints:
Timeline:
Month 0-6: Initial reverse engineering and design replication
Month 7: Patent infringement identified during legal review
Month 8-18: Alternative design development (”design-around”)
Month 19-24: Testing and validation of modified design
Results:
Engineering cost: 40% higher than original estimate
Performance: 15% lower load capacity
Patent freedom: Achieved, but at significant cost
Time-to-market: 18-month delay
Alternative Approach:
Cross-industry technology transfer from aerospace bearing applications could have yielded:
Patent-free design inspiration
Potentially superior performance
Faster development cycle
Differentiated market positioning
2.3 Cognitive Lock-In
The most insidious limitation is cognitive: when all your references come from the same industry, your solution space contracts.
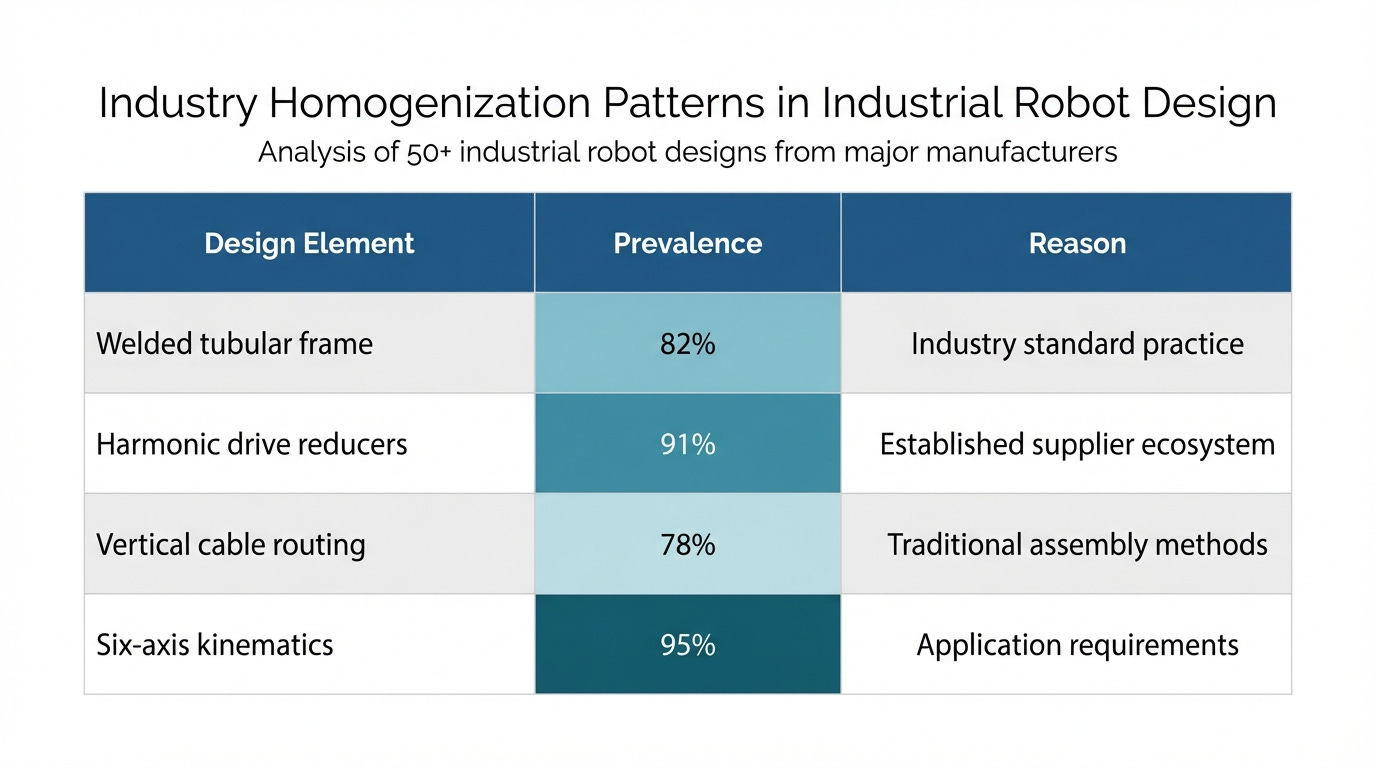
Industry Homogenization Patterns:
Convergent Evolution Problem:
When all engineers study the same references:
Design languages converge
Innovation becomes incremental
Cost optimization hits plateau
Differentiation becomes superficial
Example: Frame Construction
From 2010-2020, virtually all collaborative robot manufacturers used welded tubular steel frames because:
“Industry best practice”
Existing supplier relationships
Familiar to engineering teams
“Proven” technology
Result: Cost improvement of only 8% over decade through process optimization.
Paradigm Shift (2020+):
Manufacturers examining automotive and aerospace manufacturing adopted:
Investment casting (40% part count reduction)
Aluminum extrusion assemblies (35% weight reduction)
Composite structures (specialized applications)
New results: 25-35% cost reduction + performance improvements.
The lesson: Industry conventions often represent local optima, not global optima.
2.4 The Plateau Effect
Within a given technical paradigm, optimization follows a logarithmic curve with diminishing returns.
Typical Cost Optimization Trajectory:
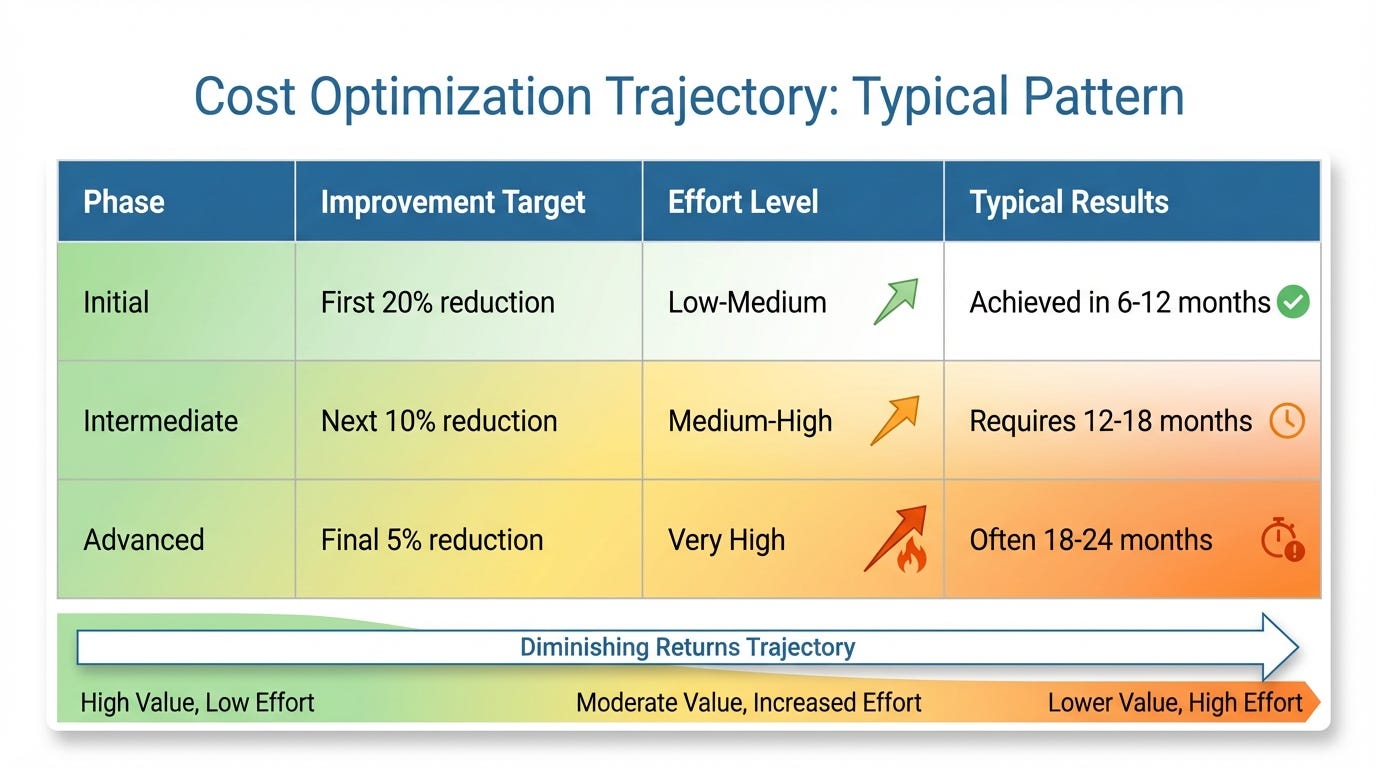
Mathematical Reality:
Each percentage point of cost reduction requires exponentially more effort within the same technical paradigm.
Real Data from Industrial Robot Manufacturer:
A major manufacturer’s experience optimizing a 6-axis robot design:
Year 1: 18% cost reduction (supply chain optimization, design refinement)
Year 2: 7% additional reduction (process improvements, DFM)
Year 3: 3% additional reduction (marginal gains across dozens of components)
Year 4: Plateau—further optimization uneconomical
Breaking the Plateau:
Breakthrough improvements require paradigm shifts, not incremental refinement:
Technology substitution (e.g., visual vs. laser navigation)
Architecture reimagination (e.g., modular vs. integrated design)
Manufacturing revolution (e.g., casting vs. welding)
Cross-industry transfer (e.g., automotive techniques to robotics)
The implication: Companies that rely solely on competitive benchmarking exhaust their optimization potential within 3-4 years. Cross-industry innovation resets the curve.
Part III: Cross-Industry Technology Transfer as a Systematic Method
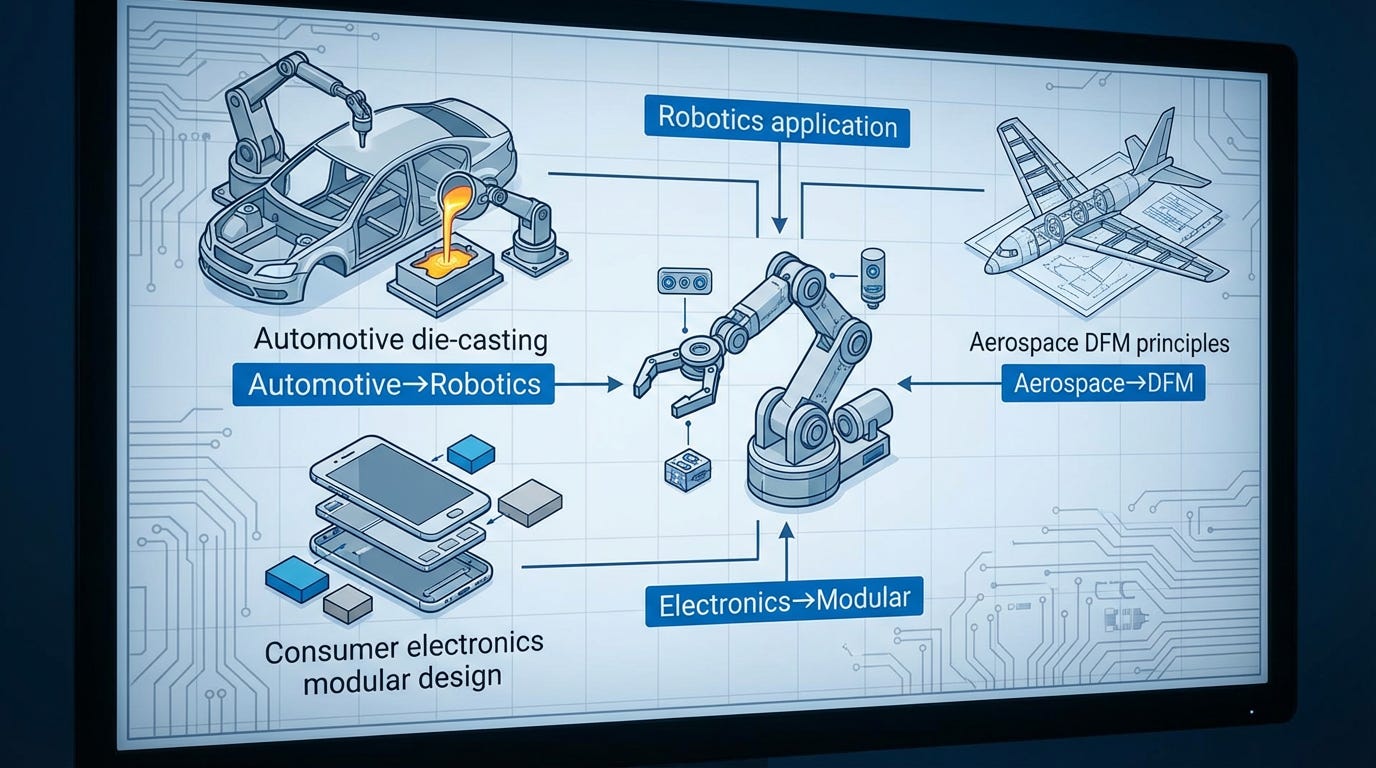
Figure 3: Technology migration pathways from adjacent industries to robotics, showing proven transfer mechanisms
3.1 Automotive Industry: Structural Innovation
The automotive industry’s century-long optimization of high-volume manufacturing provides numerous transferable innovations.
Case Study: Die-Casting Integration
Tesla’s Giga Press technology for automotive structural components inspired direct transfer to robotics manufacturing.
Traditional Robotics Approach:
30+ welded components
12 welding operations
Assembly jigs and fixtures required
High labor content (~8 hours assembly time)
Quality variation from weld inconsistency
Die-Cast Approach (Automotive-Inspired):
Single integrated casting
80% reduction in part count
Eliminated welding operations
Simplified assembly (~2 hours assembly time)
32% cost reduction
Improved structural consistency
Technical Transfer Process:
Feasibility Assessment
Geometry analysis for die-cast compatibility
Material property validation (strength, fatigue)
Tooling investment analysis
Supplier Development
Partner with automotive casting suppliers
Adapt tooling design for robot-scale components
Validate quality systems and process capability
Design Optimization
Rib structure for stiffness
Draft angles for manufacturing
Integrated mounting features
Cable routing provisions
Production Validation
First article inspection
Dimensional capability studies
Load testing and fatigue validation
Cost verification
Results Achieved:
Material cost: -15%
Labor cost: -60%
Cycle time: -75%
Quality escapes: -90%
Total cost impact: -32%
Additional Benefits:
Improved structural rigidity (+18%)
Enhanced consistency (Cpk >1.67)
Reduced quality variation
Faster production ramp capability
Scalability:
This technique scales effectively:
Small robots (<5kg payload): Die-cast aluminum
Medium robots (5-20kg): Die-cast aluminum or magnesium
Large robots (>20kg): Cast iron or steel (selective application)
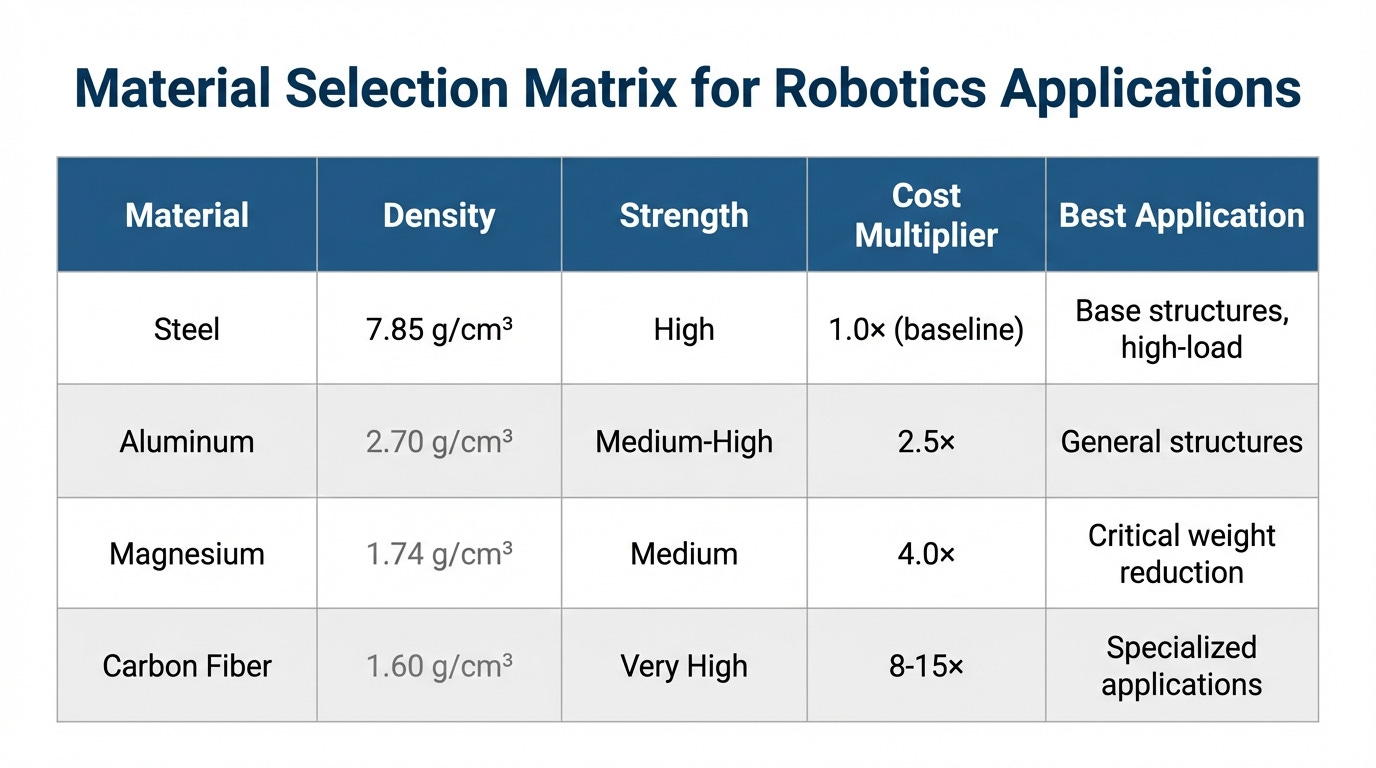
Material Science Transfer: Lightweighting
Automotive lightweighting expertise directly applies to robotics with minimal adaptation:
Material Selection Matrix:
Real Implementation Example:
A collaborative robot manufacturer applied automotive material science:
Component: Robot Arm Links
Original design: Welded steel tube, 3.2kg per link
Optimization 1: Aluminum extrusion, 1.8kg per link (-44%)
Optimization 2: Topology-optimized cast aluminum, 1.4kg per link (-56%)
System Impact:
6-axis robot total weight: 42kg → 25kg
Payload-to-weight ratio: +68%
Energy consumption: -35%
Transport/installation: Easier handling
Economic Analysis:
Material cost increase: +$180 per robot
Reduced motor/gearbox size savings: -$420 per robot
Assembly time savings: -$95 per robot
Net cost reduction: $335 per robot
3.2 Consumer Electronics: Modularization
The consumer electronics industry’s mastery of platform strategy and modular architecture offers powerful lessons for robotics.
Platform Strategy from Smartphones:
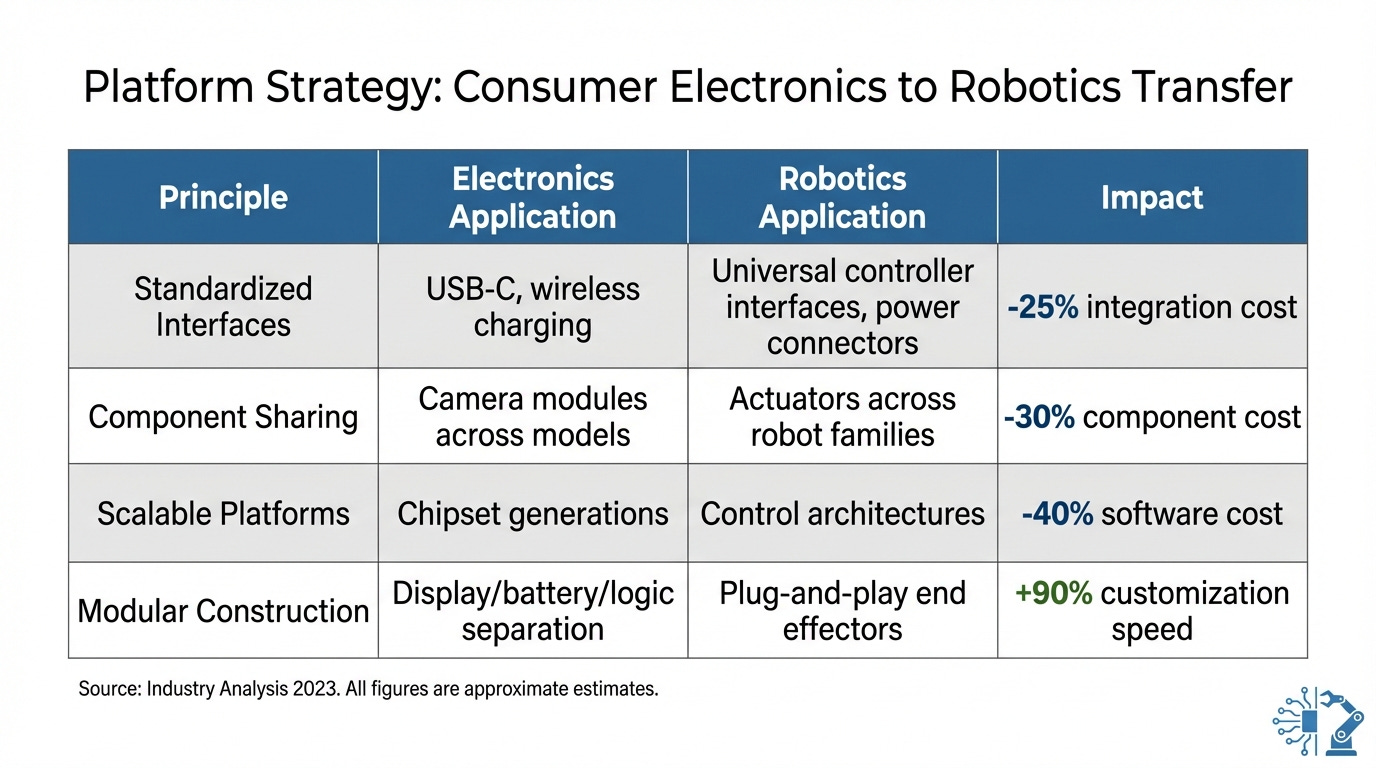
Impact on Robotics Economics:
A European industrial robot manufacturer implementing electronics-inspired modularity:
Before Modularization:
12 robot models
180 unique part numbers
Average development time: 14 months per model
Inventory carrying cost: 18% of revenue
After Modularization:
12 robot models (same external variety)
85 unique part numbers (-53%)
Average development time: 6 months per model (-57%)
Inventory carrying cost: 9% of revenue (-50%)
Total Cost Impact:
Component procurement: -25% (volume consolidation)
Inventory costs: -50% (fewer SKUs)
Development costs: -60% (platform reuse)
Overall manufacturing cost reduction: 28%
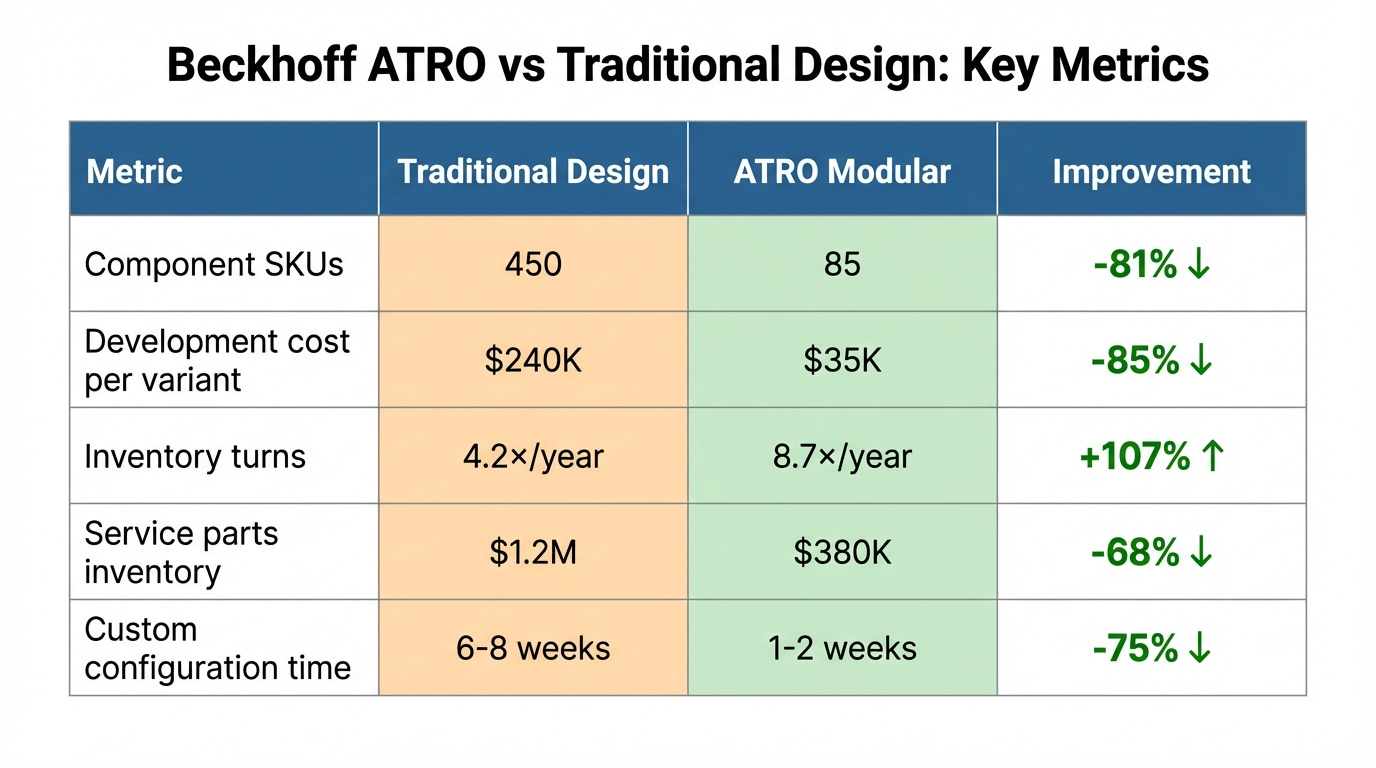
Beckhoff ATRO Modular System: Detailed Analysis
Beckhoff’s ATRO (Automation Technology for Robotics) exemplifies consumer electronics thinking applied to industrial robotics:
Design Principles:
Motor modules: Standardized interface, multiple torque classes
Connection modules: Plug-and-play linking with integrated power/data
Unlimited rotation: All axes support continuous rotation (no cable wrap)
Scalable configurations: 1-10 axes from same component set
Economic Model:
Customer Benefits:
Lower entry cost (standard modules cheaper than custom)
Faster delivery (configure vs. engineer)
Simplified service (standardized spare parts)
Future expandability (add axes without redesign)
Manufacturer Benefits:
Development cost amortized across product line
Higher volume per component (economies of scale)
Simplified inventory management
Faster market response
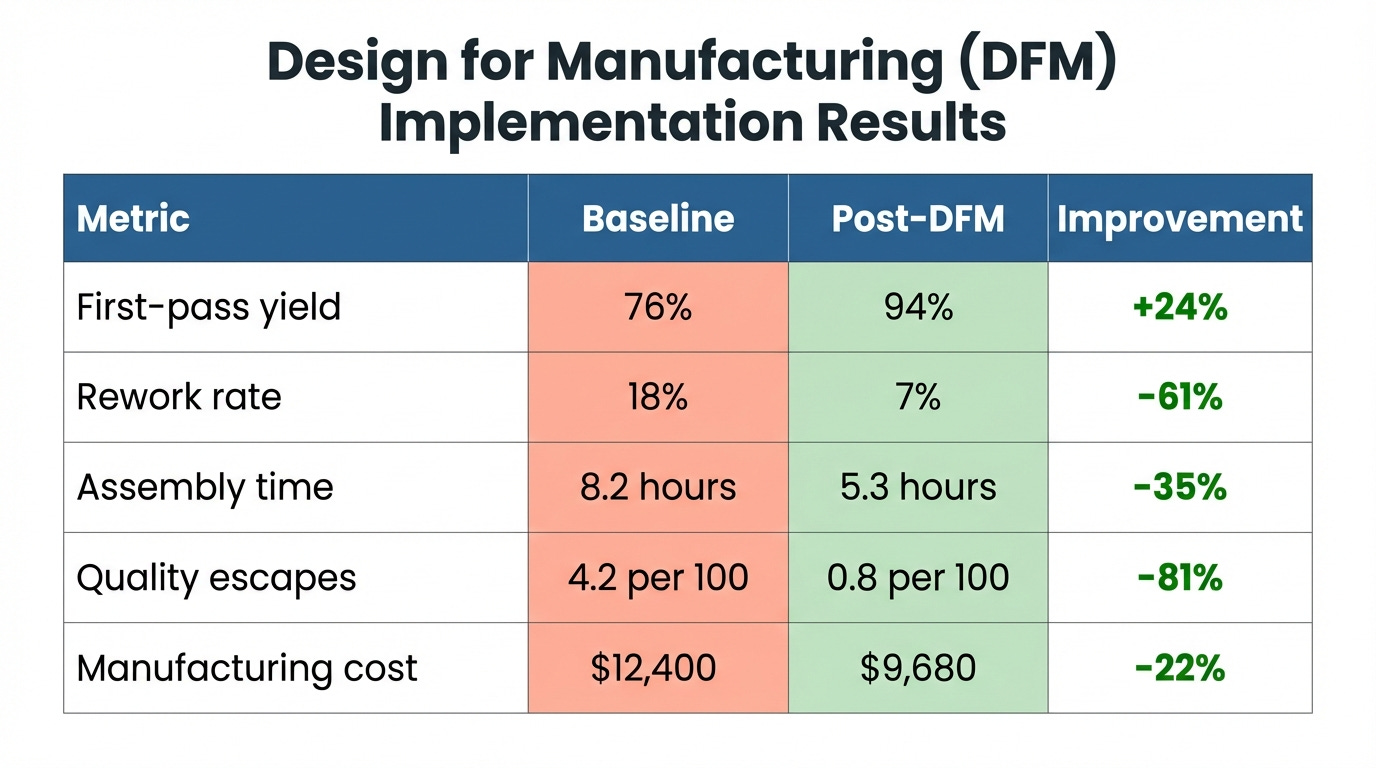
3.3 Aerospace: DFM Excellence
The aerospace industry’s extreme reliability requirements and tight tolerances have created the world’s most sophisticated Design for Manufacturing (DFM) methodologies.
Core DFM Principles from Aerospace:
Design-stage manufacturability analysis
Virtual assembly simulation
Tolerance stack-up analysis
Producibility scoring before prototype
Assembly operation minimization
“Design for Assembly” (DFA) scoring
Part consolidation strategies
Symmetrical design for orientation-insensitive assembly
First-pass yield optimization
Process capability indices (Cpk) requirements
Poka-yoke (error-proofing) integration
Statistical process control from day one
Process capability integration
Design tolerances matched to process capability
Critical characteristics identified and controlled
Supplier process audits before design freeze
Transfer to Robotics: Case Study
An Asian electronics manufacturer producing inspection robots adopted aerospace DFM principles:
Implementation Timeline:
Phase 1 (Months 1-3): Assessment & Training
Baseline process capability study
Engineering team training (40 hours)
DFM software tools implementation
Phase 2 (Months 4-9): Pilot Project
Redesign of 5-axis inspection robot
DFM principles applied to 120 components
Virtual assembly and tolerance analysis
Phase 3 (Months 10-12): Production Validation
First article inspection (15 units)
Process capability verification
Documentation and standard work
Results:
Key DFM Interventions:
Part Count Reduction
Original: 127 unique parts
Optimized: 89 unique parts (-30%)
Method: Multi-function part design, consolidation
Tolerance Rationalization
40% of tolerances tighter than necessary
Relaxed non-critical tolerances by 1-2 classes
Manufacturing cost reduction: 12%
Assembly Sequence Optimization
Eliminated 15 “flip/rotate” operations
Introduced modular sub-assemblies
Parallel assembly paths enabled
Error-Proofing (Poka-Yoke)
Asymmetric connectors (prevent mis-insertion)
Mechanical interlocks for assembly sequence
Visual alignment features
Sustainability Impact:
DFM also improves environmental metrics:
Scrap reduction: 18% less material waste
Rework energy: 60% reduction
Packaging optimization: 25% smaller footprint
3.4 Navigation Technology: Autonomous Vehicle Crossover
Mobile robot navigation directly benefits from the multi-billion dollar R&D investments in autonomous vehicles.
Technology Evolution:
Autonomous Vehicle Technology Spillover:
The AV industry’s massive investment creates robotics benefits:
Investment Scale:
Waymo: >$5 billion (2009-2024)
Cruise: >$10 billion
Tesla Autopilot: >$3 billion
Chinese AV companies: >$15 billion combined
Robotics Benefit Mechanisms:
Sensor Cost Reduction
LIDAR: $75,000 (2010) → $500 (2025)
HD cameras: $2,000 (2015) → $150 (2025)
IMU sensors: $5,000 (2010) → $50 (2025)
Algorithm Open-Sourcing
ORB-SLAM (Oxford)
Cartographer (Google)
RTAB-Map (Université de Sherbrooke)
Computing Platform Maturation
NVIDIA Jetson: $1,000, 5 TOPS (2015)
NVIDIA Orin: $500, 200 TOPS (2024)
40× performance, 50% cost reduction
Commercial Impact Analysis:
Case: Commercial Cleaning Robot Evolution
Market Penetration Effect:
The cost reduction unlocked new market segments:
2018: 12,000 units deployed globally (mostly airports, hospitals)
2024: 180,000 units deployed globally (+1,400%)
New segments enabled: Retail stores, office buildings, schools, restaurants
Technology Roadmap:
The next wave combines multiple technologies:
Visual-Inertial Odometry: Drift-free localization
3D semantic understanding: Object recognition + navigation
Multi-floor mapping: Elevator integration
Cloud fleet learning: Shared map improvements
Regional Market Dynamics:
Technology adoption varies by cost sensitivity:
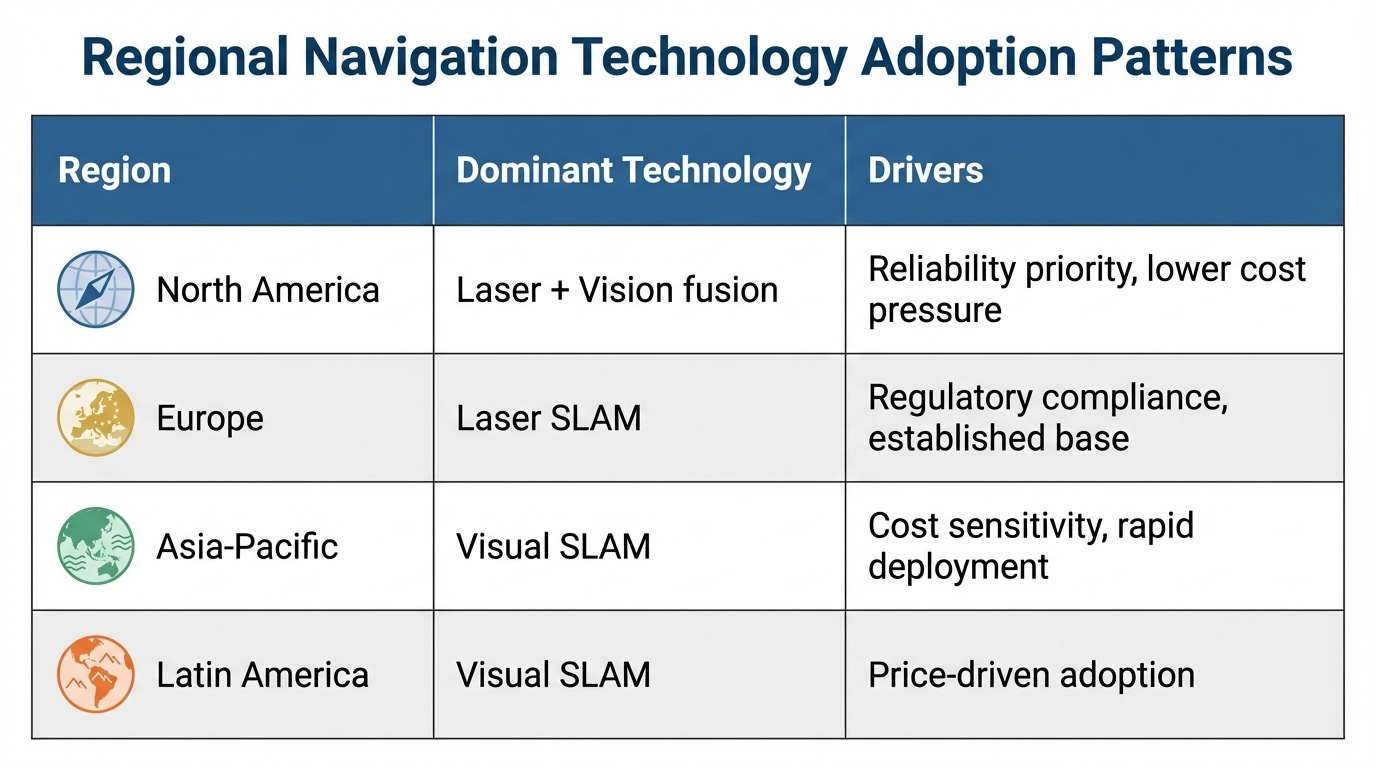
Key Insight: AV investment created a “rising tide” that lifted all boats—robotics companies globally benefit regardless of their own R&D budgets.
Part IV: The Three-Dimensional Cost Reduction Framework
Effective cost reduction operates across three dimensions simultaneously, not sequentially. Most organizations optimize in only one or two dimensions, leaving significant value uncaptured.
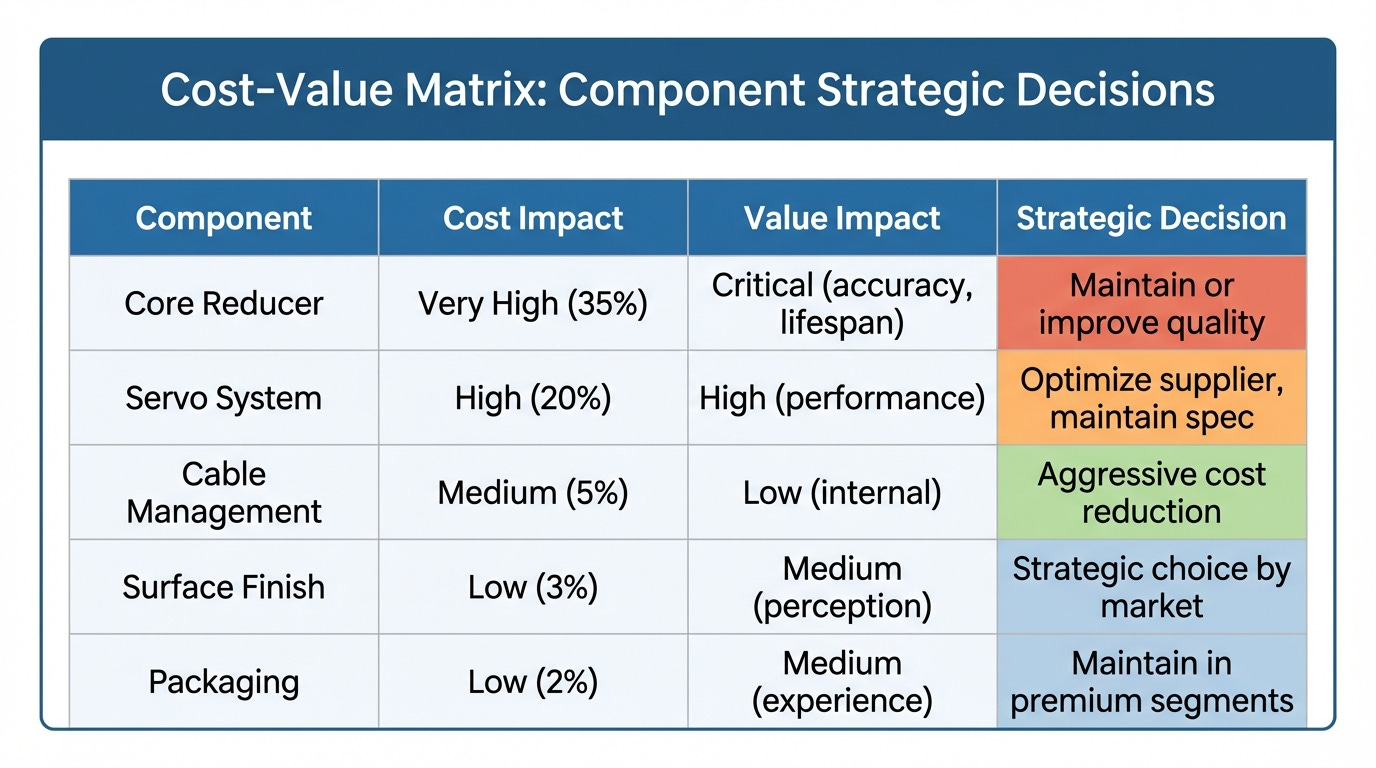
4.1 Strategic Dimension (Altitude): Cost-Value Balance
The Fundamental Question: What costs are essential to value delivery, and which are not?
Cost reduction must preserve or enhance value delivery. Indiscriminate cutting destroys competitive positioning.
Framework: Cost-Value Matrix
Real Example: Collaborative Robot De-Contenting Decision
A manufacturer analyzed 80 design elements across cost and value dimensions:
High-Value, High-Cost (Maintain):
Force/torque sensing system
Motor quality and control
Safety systems
High-Value, Lower-Cost (Protect):
Cable routing aesthetics
LED status indicators
Emergency stop accessibility
Low-Value, High-Cost (Reduce):
Over-specified connectors (industrial → commercial grade)
Unnecessary machining tolerances (relaxed 40% of specs)
Redundant documentation (streamlined)
Low-Value, Low-Cost (Maintain):
Brand badging
Color customization
Basic cable management
Results:
Total cost reduction: 18%
Customer satisfaction: Unchanged (95th percentile maintained)
Premium positioning: Preserved
The Lesson: Strategic cost reduction requires intimate understanding of what customers value versus what engineers traditionally specify.
4.2 Technical Dimension (Depth): Engineering Optimization
Systematic Engineering Cost Reduction Methods:
1. Topology Optimization
Mathematical optimization of material distribution for strength-to-weight ratio.
Example Application: Robot Link
Original design: Uniform wall thickness, 2.8kg
Topology optimized: Variable thickness, strategic ribbing, 1.7kg (-39%)
Structural performance: +5% stiffness
Cost impact: -$45 per link (material + machining time)
Tools: Ansys, Altair OptiStruct, Autodesk Fusion 360
2. Process Route Optimization
Reducing manufacturing operations through design changes.
Example: Base Plate Manufacturing
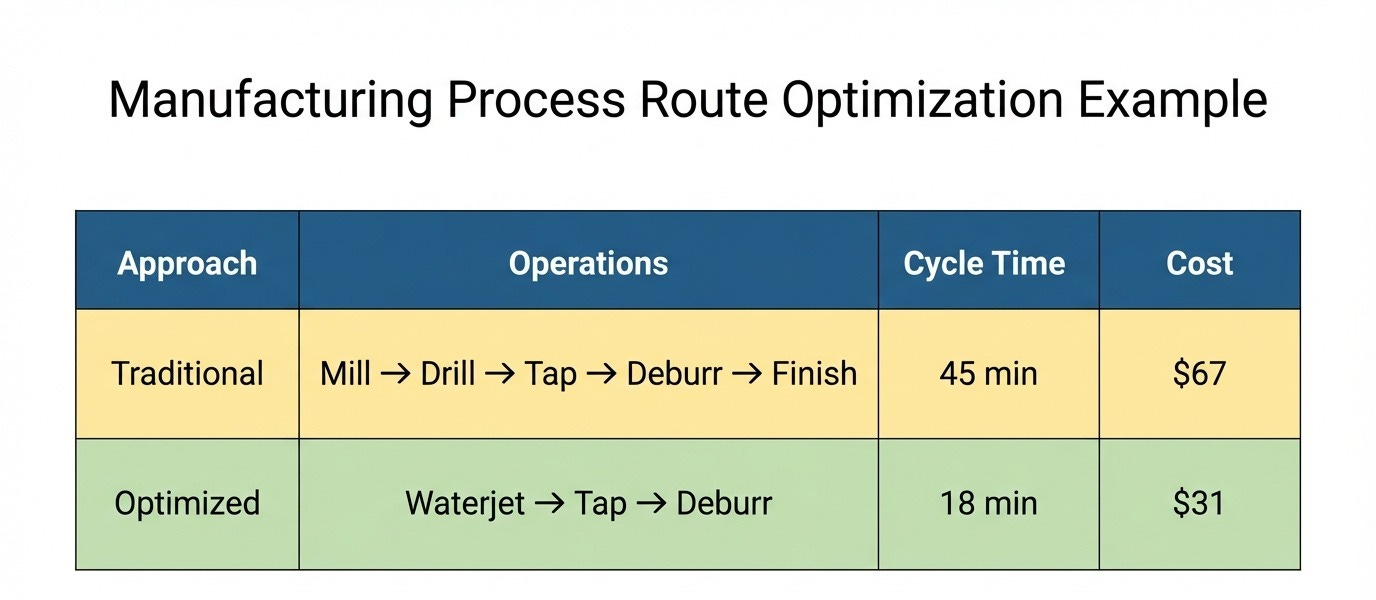
Design changes enabling optimization:
Relaxed tolerances on non-critical features
Eliminated pockets requiring milling
Standardized hole patterns
3. Material Substitution
Performance-equivalent materials at lower cost.
Case Study: Actuator Housing
Original: 6061-T6 aluminum, machined
Alternative: A380 aluminum, die-cast
Performance: Equivalent strength, slightly lower machinability
Cost: -45% (-$28 per unit)
Volume threshold: 1,000+ units for tooling ROI
4. Supply Chain Localization
Developing regional suppliers reduces logistics and diversifies risk.
Example: Asian Robot Manufacturer Entering North America
Initial (Imported):
Component sourcing: 95% from Asia
Lead time: 8-12 weeks
Logistics cost: 12% of landed cost
Supply risk: High (single-region dependency)
Localized (3 years later):
Component sourcing: 60% North American
Lead time: 2-4 weeks
Logistics cost: 4% of landed cost
Supply risk: Diversified
Total cost impact: -15% (despite higher component costs)
4.3 Cognitive Dimension (Breadth): The Innovation Multiplier ⭐
This often-neglected dimension delivers disproportionate returns because it operates outside the constraints of your current paradigm.
Why Cognitive Breadth Matters:
Engineers trained in robotics naturally reference robotic solutions. This creates convergent thinking within industry norms.
Cognitive diversity—exposure to solutions from other industries—breaks this pattern.
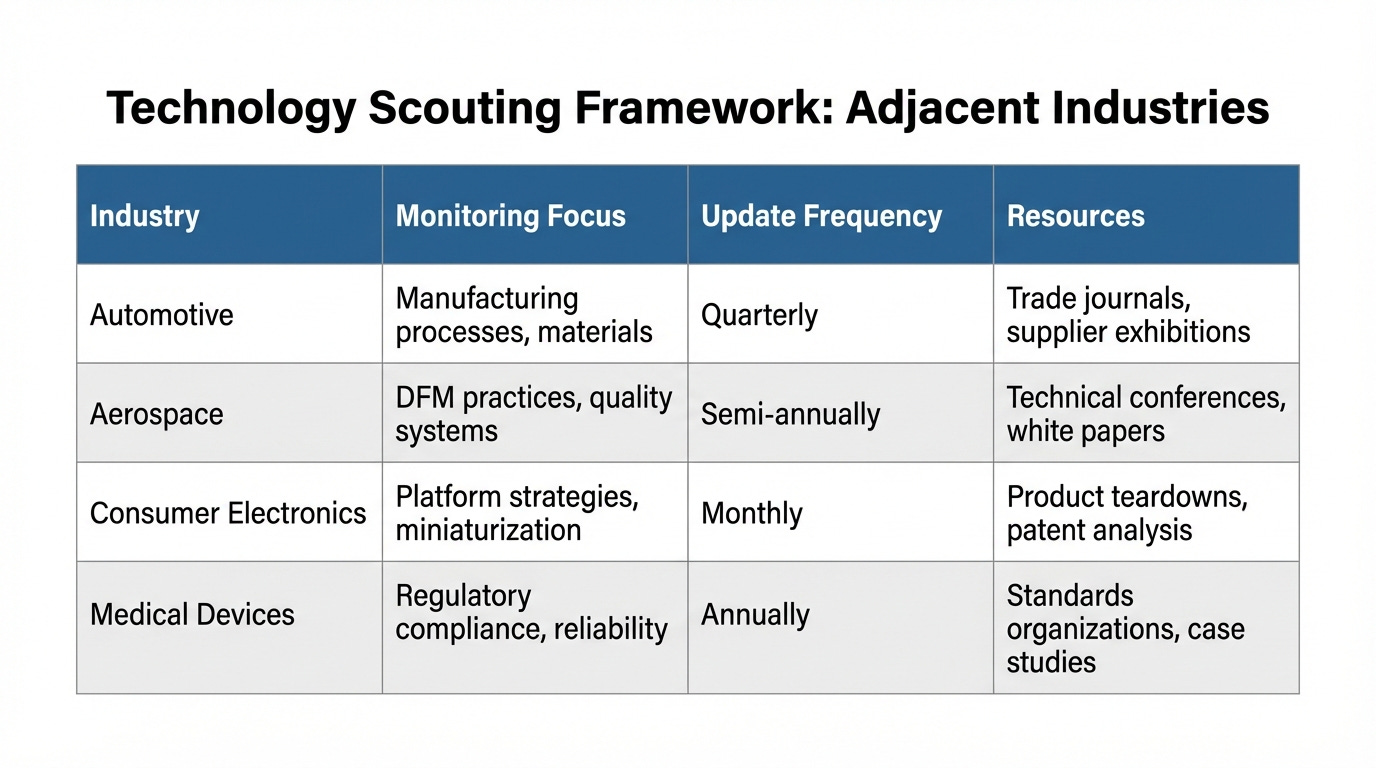
Systematic Approach to Cross-Industry Intelligence:
1. Technology Scouting Framework
Establish structured monitoring of adjacent industries:
2. Patent Landscape Analysis
Patents reveal technology directions 3-5 years before market adoption:
Example Analysis:
Search: “Lightweight actuator” in automotive sector (2019-2024)
Finding: 40% increase in magnesium alloy applications
Insight: Material science maturing, suppliers scaling capacity
Action: Robotics team evaluates magnesium for 2026 product line
Result: 28% weight reduction, 18% cost increase, net value positive
3. Supplier Cross-Pollination
Your suppliers work across industries and possess transferable knowledge:
Best Practice:
Quarterly supplier technology reviews
Question: “What innovations are you implementing for other industries?”
Document insights in technology database
Assign engineering team to evaluate applicability
Example:
Casting supplier mentions automotive lightweighting project using hybrid foam-core casting
Robotics team investigates application to robot base structure
Pilot program reveals 35% weight reduction + 18% cost reduction
Full implementation in 18 months
4. Cross-Functional Job Rotation
Engineers with multi-industry experience bring cognitive diversity:
Program Structure:
6-12 month rotations to adjacent industries (automotive, aerospace partnerships)
Structured learning objectives
Knowledge transfer upon return
Documented best practices
Results from European Manufacturer:
15 engineers completed rotations over 3 years
23 significant process improvements attributed to rotation program
Estimated value: $2.8M in cost reductions and improvements
Cultural shift toward cross-industry learning
Organizational Implementation:
Team Level:
Quarterly Cross-Industry Forums: 2-hour sessions reviewing adjacent industry trends
Innovation Budget: 5% of R&D for exploring non-obvious solutions
Failure Tolerance: Explicitly permit failed experiments from cross-industry exploration
Individual Level:
Expanded Technical Reading: 20% time allocated to non-robotics technical content
Conference Diversity: Attend 1 non-robotics conference per year
Patent Review: Monthly review of cross-industry patent applications
Project Level:
Mandatory Cross-Industry Reference: Every design review must include 2+ non-robotics precedents
“Why Not?” Analysis: Question industry assumptions explicitly
Alternative Costing: Estimate cost of solutions from other industries before defaulting to robotics norms
Cultural Level:
Celebrate Paradigm-Shifting Ideas: Recognize proposals that challenge conventions
Failure Retrospectives: Document valuable lessons from unsuccessful cross-industry transfers
Knowledge Sharing: Internal wiki documenting cross-industry insights
Part V: Implementation Roadmap
5.1 Organizational Capabilities: Building the Foundation
Phase 1: Assessment (Months 1-3)
Current State Analysis:
Map existing cost structure with granular detail
Benchmark against competitive products
Identify cognitive biases in team (”we’ve always done it this way”)
Survey adjacent industries for relevant innovations
Assess IP landscape for constraints and opportunities
Deliverables:
Cost waterfall diagram showing component-level breakdown
Competitive benchmarking report (know your baseline)
Cross-industry opportunity matrix
IP freedom-to-operate analysis
Prioritized improvement opportunities
Phase 2: Capability Building (Months 4-9)
Cross-Industry Awareness:
Subscribe to trade publications from automotive, aerospace, electronics
Attend cross-industry conferences (SAE, AIAA, IEEE)
Establish relationships with suppliers serving multiple industries
Create cross-industry patent monitoring alerts
Develop technology scouting framework
Training Programs:
DFM/DFA training (40 hours, certification optional)
Topology optimization tools (Ansys, Altair)
Cost modeling and analysis
IP landscape navigation
Cross-industry case study workshops
Tools & Systems:
Implement cost modeling software
Create innovation database (cross-industry insights)
Establish design review checklists (cross-industry references mandatory)
Develop supplier technology questionnaire
Phase 3: Pilot Projects (Months 10-18)
Project Selection Criteria:
Medium cost impact ($100K-$500K annual savings potential)
Limited scope (single subsystem)
Measurable outcomes
Acceptable failure risk
Example Pilot Projects:
Pilot A: Automotive Casting Transfer
Objective: Replace welded frame with cast structure
Timeline: 12 months
Investment: $180K (tooling + engineering)
Success criteria: 20% cost reduction, equivalent performance
Pilot B: Electronics Modularization
Objective: Platform strategy for controller architecture
Timeline: 15 months
Investment: $240K (redesign + validation)
Success criteria: 30% SKU reduction, 15% cost reduction
Pilot C: Aerospace DFM Application
Objective: Reduce assembly operations by 40%
Timeline: 9 months
Investment: $95K (design optimization + tooling changes)
Success criteria: 25% assembly time reduction
Documentation:
Detailed project plans with milestones
Risk registers and mitigation strategies
Regular steering committee reviews
Comprehensive retrospectives
Phase 4: Scaled Implementation (Months 19-36)
Rollout Strategy:
Based on pilot results:
Success: Scale to similar applications across product line
Partial success: Refine methodology, second-generation pilot
Failure: Document lessons, pivot approach
Organizational Integration:
Formal design review gates with cross-industry requirements
Cost reduction targets allocated across three dimensions
Innovation metrics tracked at team and individual level
Supplier collaboration program established
Knowledge management system populated
Continuous Improvement:
Quarterly reviews of cross-industry landscape
Annual benchmarking against competitive cost structures
Systematic capture of emerging technologies
Regular training refreshers and capability updates
5.2 Individual Mindset: Engineering Team Development
Cultivating Cross-Industry Thinking:
Monthly Practices:
Technical Paper Review: Each engineer presents one non-robotics paper
Patent Analysis: Review 5 patents from adjacent industries
Product Teardown: Analyze consumer or automotive product with cost focus
Quarterly Practices:
Industry Immersion: Visit automotive plant, electronics manufacturer, or aerospace facility
Supplier Technology Day: Deep dive with key suppliers on their innovation roadmap
Scenario Planning: “What if we applied X industry’s approach to our Y problem?”
Annual Practices:
Cross-Industry Conference: Each engineer attends one non-robotics conference
Rotation Program: 1-2 engineers on temporary assignment to adjacent industry
Innovation Summit: Full team workshop exploring paradigm-shifting ideas
Incentive Alignment:
Performance reviews include “cognitive breadth” dimension
Innovation awards for cross-industry transfer ideas
Publication encouragement in cross-industry forums
Career development paths reward diverse experience
5.3 Project Execution: Practical Framework
Stage 1: Opportunity Identification
Activities:
Detailed cost structure mapping
Value analysis (customer priorities vs. cost drivers)
Cross-industry technology scan
IP landscape review
Supplier capability assessment
Outputs:
Prioritized opportunity list
Technology transfer feasibility assessments
Preliminary ROI estimates
Risk identification
Go/No-Go Criteria:
Minimum $100K annual savings potential
Technical feasibility >70% confidence
IP freedom-to-operate confirmed
Supplier support committed
Stage 2: Feasibility Deep Dive
Technical Analysis:
Performance modeling and simulation
Material compatibility verification
Manufacturing process validation
Quality system implications
Regulatory compliance check
Economic Analysis:
Detailed cost modeling (material, labor, tooling, overhead)
Investment requirements (NRE, capital equipment)
Volume sensitivity analysis
NPV and IRR calculation
Payback period assessment
Risk Analysis:
Technical risks (performance, reliability)
Supply chain risks (supplier capability, capacity)
Market risks (customer acceptance, competitive response)
IP risks (patent infringement, design-around costs)
Outputs:
Detailed business case
Risk mitigation plan
Project plan with milestones
Resource requirements
Stage 3: Pilot Implementation
Execution:
Design iteration with cross-functional team
Prototype development and testing
Supplier qualification and validation
Cost verification (actual vs. modeled)
Performance validation
Validation:
First article inspection
Reliability testing (accelerated life)
Customer beta program (if applicable)
Manufacturing process capability study
Quality system documentation
Decision Point:
Proceed to production: Clear success, meet all criteria
Iteration required: Promising but needs refinement
Terminate: Fundamentally flawed, pivot to alternative
Stage 4: Production Scale-Up
Launch Preparation:
Manufacturing process documentation
Supply chain activation (capacity, contracts)
Quality control plan implementation
Training (assembly, inspection, maintenance)
Launch readiness review
Ramp Management:
Controlled production ramp (50 → 200 → 1000+ units)
Closely monitored quality metrics
Cost tracking vs. model
Customer feedback loop
Continuous improvement actions
Sustaining Phase:
Ongoing cost optimization
Supplier performance management
Design refinement based on field data
Lessons learned documentation
Technology transfer to other product lines
Conclusion: From Cost Follower to Innovation Leader
The robotics industry stands at an inflection point. Cost pressures intensify as the market expands and matures, while technical possibilities multiply through advances in AI, materials science, and manufacturing technologies. Success in this environment requires transcending the limitations of competitive benchmarking.
Key Insights Recap:
1. Competitive Benchmarking’s Inherent Limitations
Creates followers, not innovators
Provides solutions without problem-solving context
Leads to industry homogenization
Produces diminishing returns within paradigms
Cannot break through cost plateaus
2. Cross-Industry Transfer as Systematic Methodology
Unlocks non-linear cost reductions (25-40% vs. 5-10%)
Provides patent-free design inspiration
Breaks cognitive lock-in patterns
Resets optimization curves
Creates differentiated market positioning
3. Three-Dimensional Framework Necessity
Strategic (Altitude): Cost-value balance preservation
Technical (Depth): Engineering optimization rigor
Cognitive (Breadth): Cross-industry intelligence—the force multiplier
4. Implementation as Organizational Capability
Not occasional insight, but systematic process
Requires investment in awareness, tools, culture
Builds compounding competitive advantage
Creates sustainable cost leadership
The Path Forward: Practical Next Steps
For Engineering Teams:
This Month: Subscribe to one automotive and one aerospace publication
This Quarter: Attend one cross-industry conference or facility tour
This Year: Pilot one cross-industry technology transfer project
Long-term: Build systematic cross-industry monitoring capability
For Engineering Managers:
Immediate: Add cross-industry reference requirement to design reviews
Near-term: Allocate 5% R&D budget to exploratory cross-industry projects
Medium-term: Establish technology scouting and patent monitoring process
Strategic: Develop cross-industry rotation program for key engineers
For Executives:
Strategic: Commission cross-industry opportunity assessment
Organizational: Measure and reward cognitive breadth in performance systems
Investment: Fund DFM training and cross-industry exploration
Cultural: Celebrate paradigm-shifting ideas, even failed experiments
The Compounding Advantage
Organizations that master cross-industry technology transfer gain advantages that compound over time:
Year 1 Benefits:
Identification of non-obvious cost reduction opportunities
Avoidance of competitor patent minefields
Fresh perspective on industry assumptions
Year 3 Benefits:
Systematic cost advantage across product line
Differentiated technical capabilities
Supplier relationships across industries
Organizational learning culture
Year 5+ Benefits:
Industry leadership in cost position
Innovation reputation attracting talent
Platform advantages (modular, scalable architectures)
Sustainable competitive moat
Final Reflection
True cost reduction doesn’t come from copying what others do—it comes from understanding why others can do it, and transferring those fundamental principles to create your own systematic solutions.
The boundary of cost reduction is redefined not by industry norms, but by cognitive breadth and systematic execution.
When you evolve from competitive benchmarking to cross-industry technology transfer, you transform from a cost follower to an innovation leader. Your cost structure becomes a strategic advantage, not just an operational metric.
The robotics companies that thrive in the next decade will be those that look beyond their industry for inspiration, systematically transfer innovations from adjacent fields, and build organizational capabilities for continuous paradigm-shifting thinking.
The question is not whether to adopt cross-industry thinking, but how quickly you can build this capability before your competitors do.
About This Analysis
This analysis draws on technical and economic research across the global robotics industry, examining cost structures, manufacturing innovations, and technology transfer patterns from automotive, aerospace, and consumer electronics sectors. The frameworks presented have been validated through implementations at industrial, collaborative, mobile, and humanoid robot manufacturers across North America, Europe, and Asia.
The case studies represent real implementations with details modified for confidentiality where appropriate. All cost figures and percentage improvements are based on documented industry data or direct manufacturer reporting.
Further Reading & Resources
Cross-Industry Technology Transfer:
“Innovation from Adjacent Industries: A Framework” - MIT Sloan Management Review
“The Medici Effect: Breakthrough Insights at the Intersection of Ideas” - Frans Johansson
“Design for Manufacturability Handbook” - McGraw-Hill Professional
Robotics Cost Engineering:
“Cost structure evolution in humanoid robotics” - IEEE Robotics & Automation Magazine
“Supply chain strategies for component localization” - International Journal of Production Economics
“DFM implementation frameworks for robotics” - Journal of Manufacturing Systems
Industry Reports:
International Federation of Robotics: World Robotics Report (Annual)
ARK Invest: Big Ideas Report (Annual) - Robotics section
McKinsey: “The Future of Manufacturing” reports
Technology Scouting:
Google Patent Search - Set up alerts for adjacent industry innovations
TechCrunch, IEEE Spectrum - Cross-industry technology news
SAE International, AIAA - Technical paper databases
🎯 Master Robotics Engineering (The Way School Never Taught)
After 13 years in the field, I’ve learned that the best engineering knowledge doesn’t come from textbooks—it comes from real projects, failures, and breakthroughs.
That’s what I share every week in The Robotics Engineer’s Digest:
Technical Deep Dives → Real engineering analysis with formulas
Case Study Breakdowns → Learn from $100K+ mistakes (so you don’t repeat them)
Component Selection Guides → Decision frameworks for motors, reducers, sensors
Industry Intelligence → What’s actually happening in humanoid robotics, automation, AI
100% free. Zero spam. Unsubscribe anytime.
💬 What Are You Working On Right Now?
I create content based on what engineers actually need.
Comment below and tell me:
What type of robot/automation project are you working on?
What’s your biggest technical challenge right now?
What topic would you like me to cover next?
100+ engineers have already shared. Your input shapes future articles!
Join 100+ robotics engineers getting smarter every week:
Couldn't agree more, this insight on moving beyond competitive benchmarking is spot on. It makes me think of your earlier work exploring systemic shifts in technology development. I wonder if this 'cost reduction parodox' is something we see in AI model training too, where everyone tries to beat the same benchmark?